Deep Dive into OpenTelemetry in Saleor
Learn how Q4 doesn't have to stress your team. See what's really happening inside your commerce stack by streaming Saleor telemetry into your observability tools.
During the high-stakes Q4 ecommerce season, every second of downtime hurts.
As Łukasz describes in his article, "How Saleor keeps reliability high", monitoring and observability are the foundation of keeping things stable. This post focuses on one concrete piece of that picture: how we use OpenTelemetry in Saleor. In this article, we'll walk through what OpenTelemetry is, its fundamentals, and what it has to offer in the context of Saleor and Saleor apps.
Starting from version 3.21, Saleor ships with built-in OpenTelemetry support. That doesn't mean we were flying blind before. For years we relied on standards like OpenTracing and a set of other tools to monitor Saleor in production. They served us well, but the ecosystem has moved on, and OpenTelemetry is becoming the de facto industry standard for telemetry: it's actively developed, comes with well-defined protocols and data structures, supports many programming languages, and brings a rich ecosystem of tools.
OpenTelemetry also fits well with how we think about openness. It's a vendor-neutral, open-source observability framework. That means we and our users, especially Saleor Cloud customers, are free to choose the observability backend that suits us best.
OpenTelemetry in a Nutshell
Observability as a feature lets you monitor performance, debug issues, and improve reliability by examining its outputs - the telemetry it emits.
There are various levels of insight observability can provide. At one end of the spectrum, you have simple status pages that only tell you whether a service is up or down. A step further are telemetry feeds and dashboards for a single service, showing things like latency, error rates, and throughput. And at the top are full observability frameworks that collect and correlate telemetry data from many distributed services, so you can see how the whole system behaves, not just each component in isolation.
OpenTelemetry (OTel) is the third type. It gives us a standardized way to:
- generate telemetry data in our services
- encode and transport it (via the OpenTelemetry Protocol, OTLP)
- and process and export it to the observability backend of our choice
It standardizes three main kinds of telemetry signals:
- Traces - records of end-to-end operations
- Metrics - numeric measurements over time
- Logs - timestamped event records
OpenTelemetry is deliberately not a storage or visualization system. Instead, it defines standards that are supported by many observability backends such as Datadog, New Relic, Grafana, and Prometheus, or built-in Google Cloud observability tool.
The key advantages are:
- No vendor lock-in - instrument once, swap backends if needed
- One set of APIs and conventions - the same mental model across services and languages
- Broad ecosystem support - many frameworks and libraries already integrate with OTel
That means you can plug Saleor into the observability stack you already use.
How OpenTelemetry Fits Into a Saleor Stack
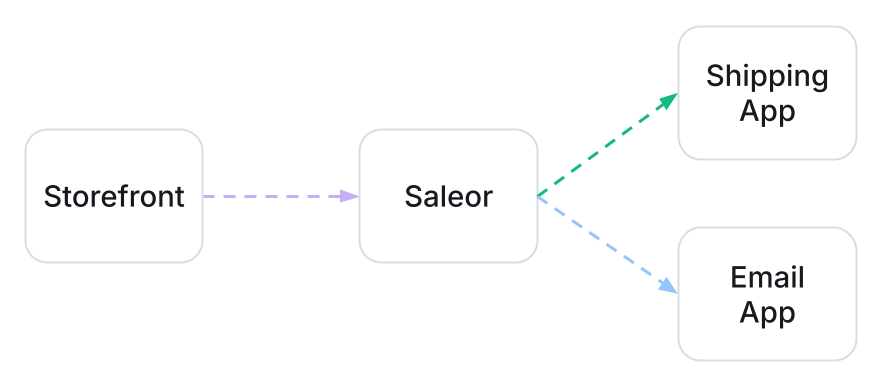
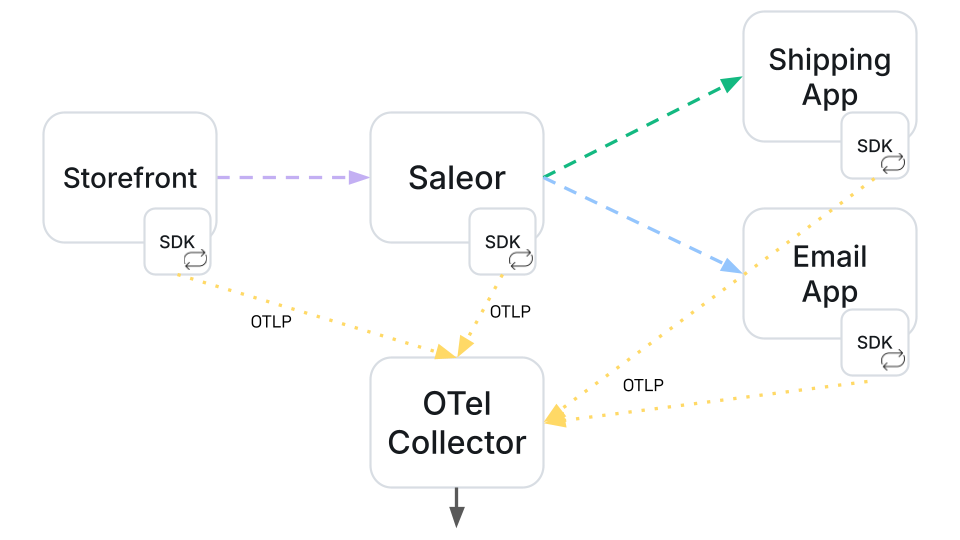
We'll use a simple Saleor-based ecommerce setup to help illustrate how OpenTelemetry works in practice. Let's imagine a typical stack:
- a storefront (web or mobile) talking to Saleor via GraphQL
- the Saleor service acting as the central ecommerce engine
- several Saleor apps and custom apps integrated via webhooks (shipping, payments, search, etc.)
Saleor is the hub, but other services can be just as critical. Our goal with OpenTelemetry is to observe this whole system end to end, not just one component at a time.
If you're running Saleor as part of a revenue-critical stack, this is where observability stops being "nice to have" and becomes a must have.
Traces: Following a Request Through Your System
Traces are often the most eye-opening part of observability. A trace shows what happens when a single request enters the system and flows through it. It's built from spans, which represent units of work such as handling an HTTP request, executing a GraphQL operation, or calling an app.
Spans form parent-child relationships. This structure lets you see which operation triggered which, and how they all relate within a single request.
Each span typically contains information like:
- a span ID and trace ID,
- start and end timestamps and duration,
- status (success/error),
- and optional attributes (key-value metadata) such as HTTP status code or GraphQL operation name.
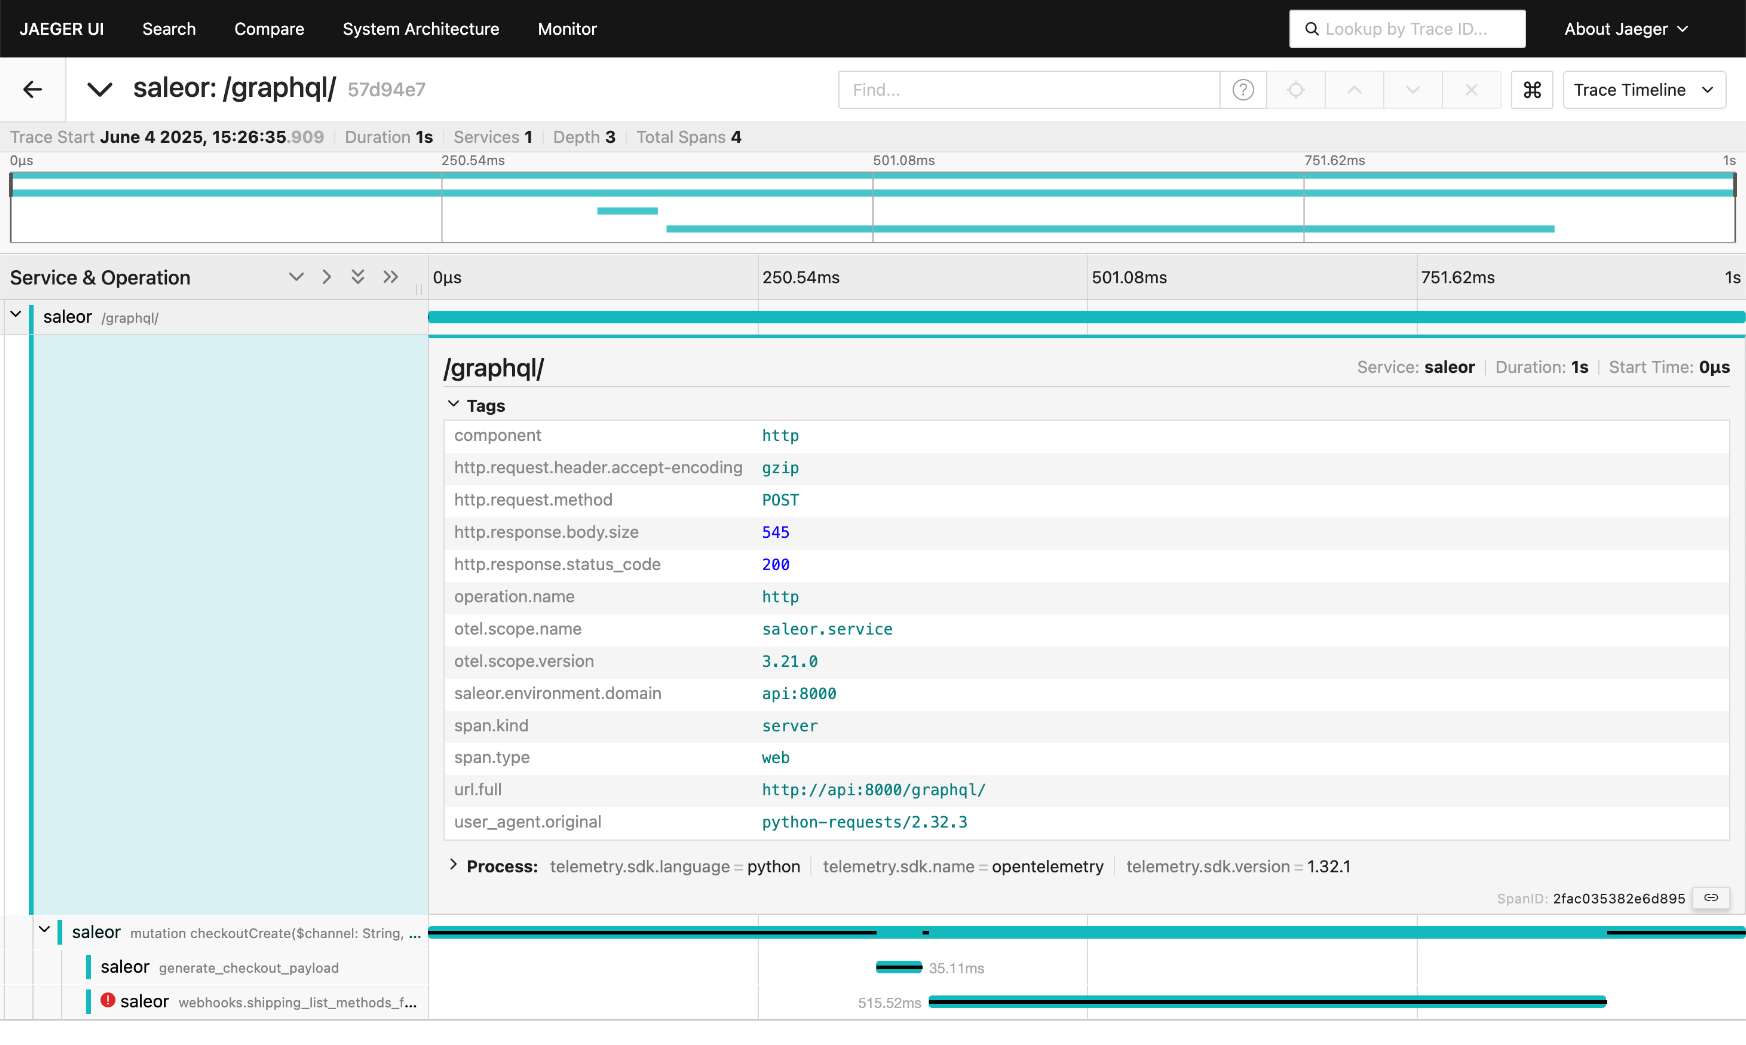
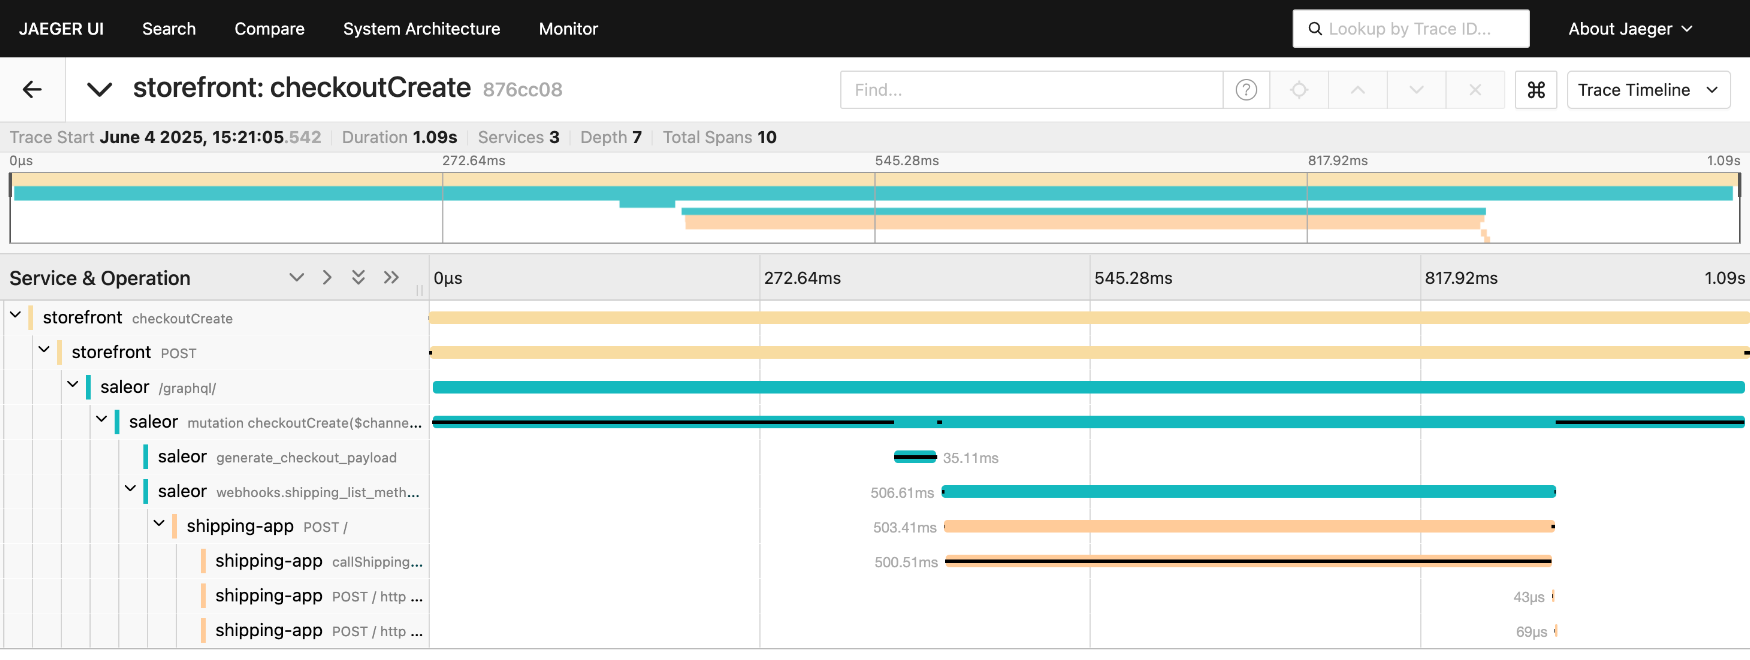
In a trace viewer like Jaeger, you see spans as a flame graph or waterfall. That's where any bottlenecks stand out. In the example below, most of the request time is spent in a call to the shipping app, and the span status indicates an error. Now you know where to look first.
Instrumentation
The process of making your code emit telemetry signals is called instrumentation. With OpenTelemetry, you can instrument code manually (code-based) using language-specific APIs and SDKs. Here's an example that creates a parent span with a nested child span and a few attributes:
Although this example is in Python, the same pattern exists in all major languages. OpenTelemetry provides official libraries for Python, JavaScript/TypeScript, Go, Java, .NET, and more.
When adding attributes, it's a good idea to use Semantic Conventions wherever possible. These are predefined attribute names and structures for spans, metrics, logs, and resources (HTTP, GraphQL, databases, messaging, and more). They make telemetry consistent and easier to correlate across services and signals. You can always add your own custom attributes on top when you need domain-specific context.
OpenTelemetry also supports zero-code (automatic) instrumentation. This is a set of integrations that patch popular libraries and frameworks at runtime-for example, HTTP servers and clients, database drivers, and web frameworks like Django or Express. With auto-instrumentation enabled, your app starts emitting useful spans and metrics with minimal changes. You can explore the available integrations in the OpenTelemetry instrumentation registry.
Saleor itself and the official Saleor apps already come instrumented with OpenTelemetry. If you're building a custom app, auto-instrumentation is often the fastest way to plug into this ecosystem and start sending telemetry alongside the signals that Saleor already produces.
Context Propagation
So far we've focused on spans within a single service. To get a true distributed trace across multiple services, we need a way to carry trace information across network boundaries. That's what context propagation is for.
In OpenTelemetry, the trace context includes the trace ID, span ID, trace flags, and optional trace state. Propagators are responsible for encoding that context into carriers (for example, HTTP headers) and decoding it on the receiving side. The receiving service then uses this context when creating its own spans so they share the same trace ID, and continues propagating it to any services it calls next.
For HTTP, OpenTelemetry defaults to the W3C TraceContext format - headers like traceparent (and optionally tracestate) that carry this context between services.
Thanks to context propagation, we get one distributed trace that shows the full path of a request through the system. In Jaeger, that looks like a single trace that starts in the storefront, continues through Saleor, and then branches out into spans from shipping, payment, and other apps. This is where the "end-to-end" part of observability really comes alive.
The same information also lets observability backends automatically generate service maps. Below is one created by Jaeger, and it closely matches the Saleor-based stack from our example: the storefront calling Saleor, and various apps around it.
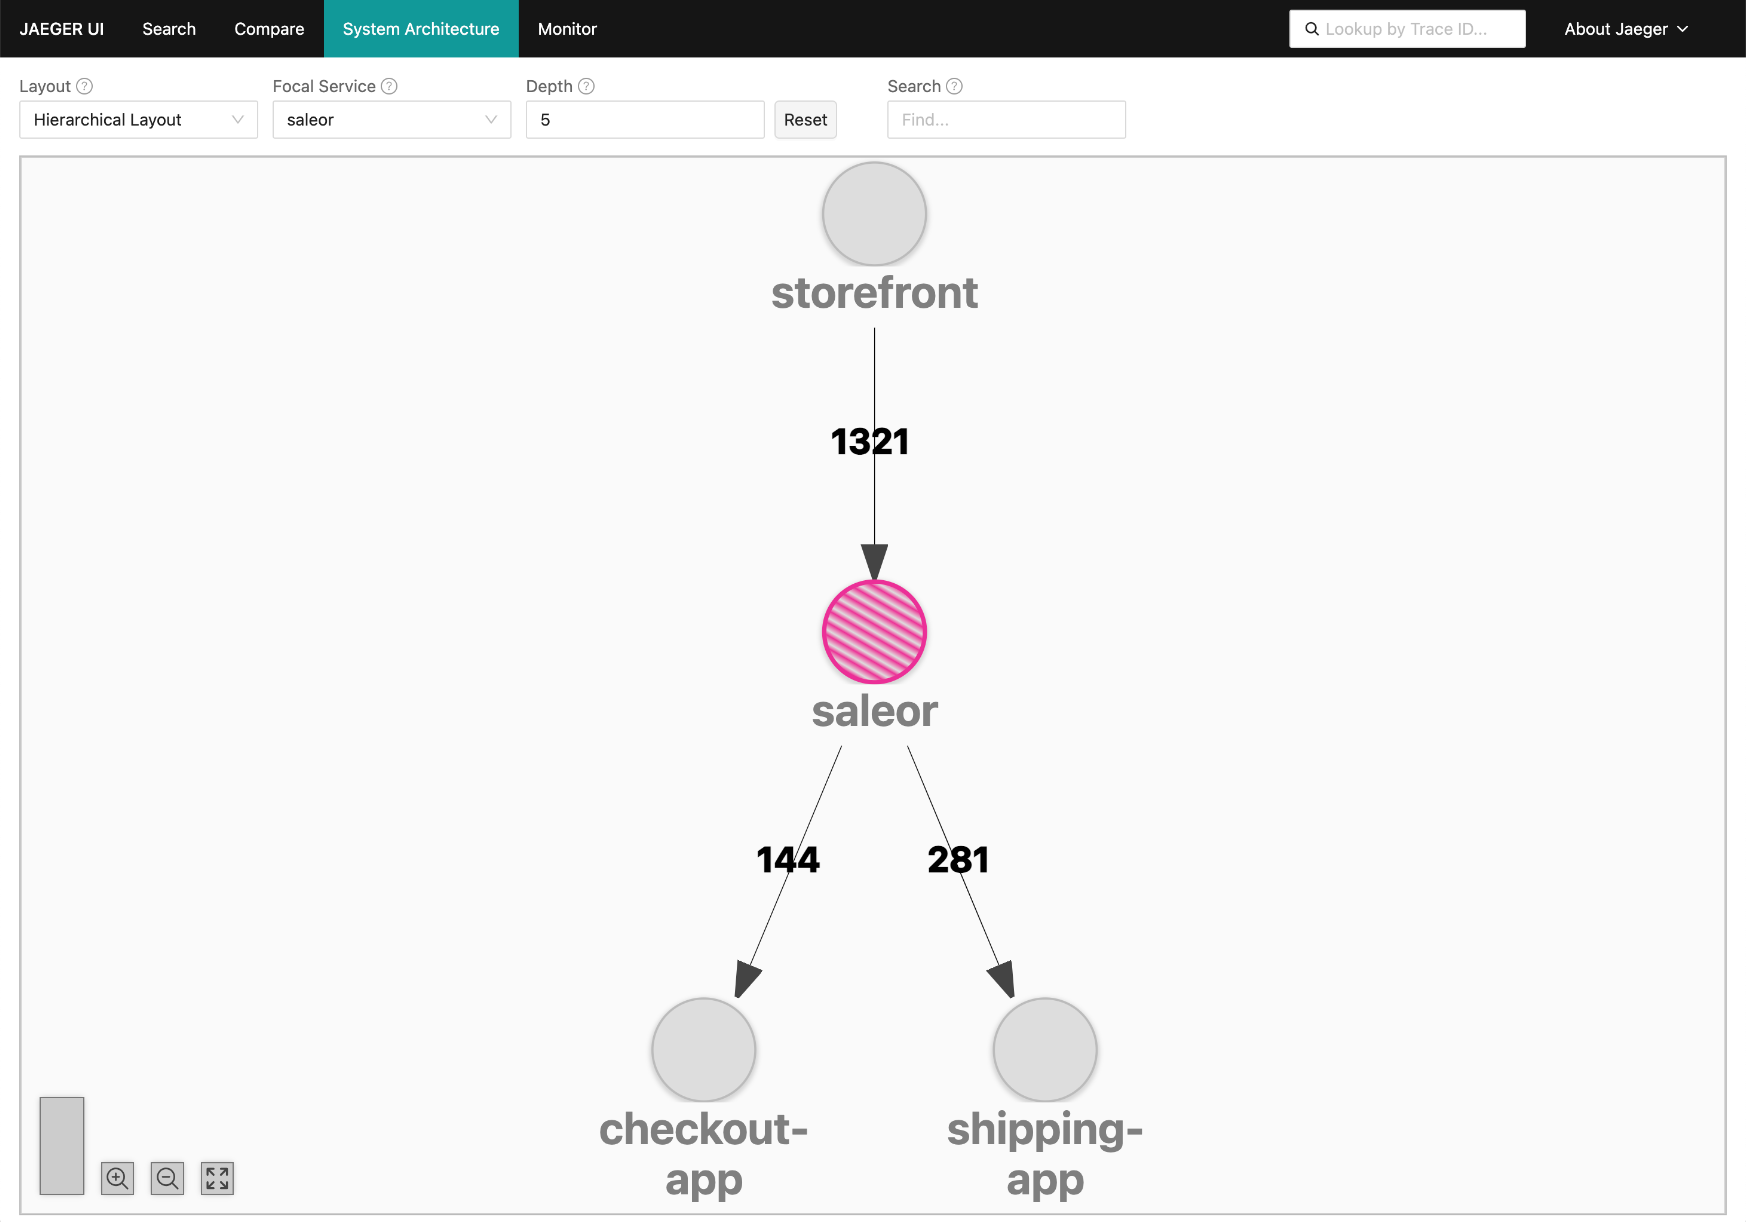
That's the power of context propagation: your observability tools can automatically infer and visualize your system's architecture from telemetry data.
Sampling
Collecting and storing a trace for every single request quickly becomes expensive. High-traffic systems can generate enormous volumes of telemetry, and keeping all of it isn't always necessary. That's why we rely on sampling.
Sampling means we only keep a subset of all traces while still preserving enough detail to understand how the system behaves. We accept that we don't see every request in traces. Metrics handle full statistics and trends, while traces give us representative data to investigate in detail.
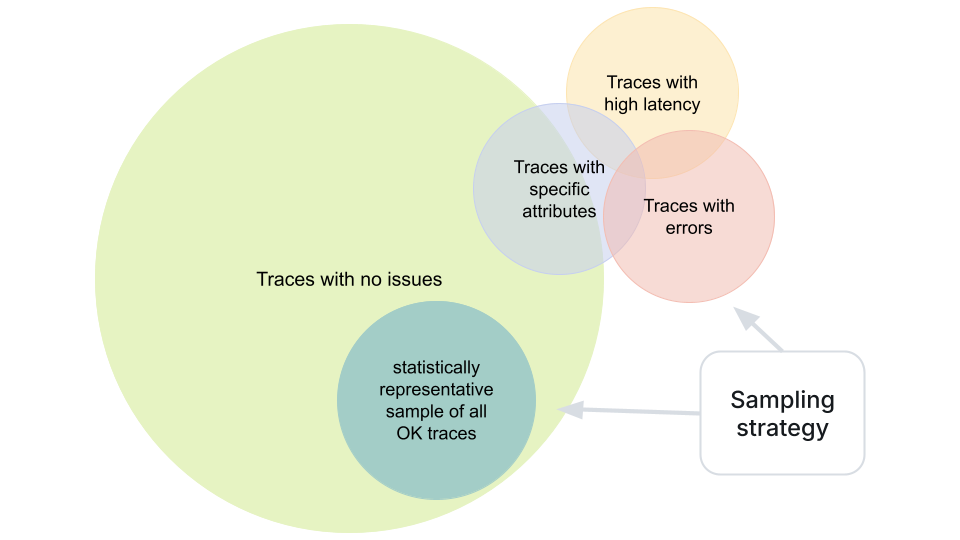
OpenTelemetry supports several sampling strategies. The simplest is probabilistic sampling - for example, keeping 1-5% of all traces. More advanced or custom strategies can have different sampling levels for traces that match certain conditions, such as those that:
- contain errors
- have high latency
- have specific attribute values
The result is a practical balance: telemetry stays affordable and manageable, while we still capture the most valuable traces - the ones that reveal issues, bottlenecks, and unusual behavior.
Metrics: System Health in Numbers
Since traces are sampled, which disqualifies them as a source for building accurate statistics. Metrics fill that gap. They are numeric measurements collected over time. They're efficient to store and query, and they typically represent all events, not just a sample. They give us a high-level view of system health and behavior.
OpenTelemetry defines several metric types, including Counter, UpDownCounter, Gauge, and Histogram, plus asynchronous variants of those. In Saleor, we mostly rely on Counters and Histograms for request counts and durations, and Gauges for "current state" values like queue depth.
We can attach attributes like operation name, error flag, or app identifier, which later lets us break metrics data down in more detail.
Here are some example Saleor metrics:
saleor.graphql.operation.count:
| Type | Unit | Description |
|---|---|---|
| Counter | {request} |
Total number of GraphQL operations processed by Saleor |
Attributes:
| Key | Description | Example values |
|---|---|---|
graphql.operation.type |
Type of GraphQL operation | query; mutation |
error.type |
Category of error raised during operation processing | graphqlLocatedError; graphqlSyntaxError |
saleor.external_request.duration:
| Type | Unit | Description |
|---|---|---|
| Histogram | s |
Duration of external requests sent from Saleor (such as webhooks) |
Attributes:
| Key | Description | Example values |
|---|---|---|
saleor.app.identifier |
Saleor app identifier | app.saleor.adyen; saleor.app.avatax |
saleor.webhook.event_type |
Type of webhook event being delivered | payment_gateway_initialize_session; customer_updated; checkout_fully_paid |
saleor.webhook.execution_mode |
Execution mode of the webhook | async; sync |
error.type |
Category of error that occurred while sending the external request | request_error |
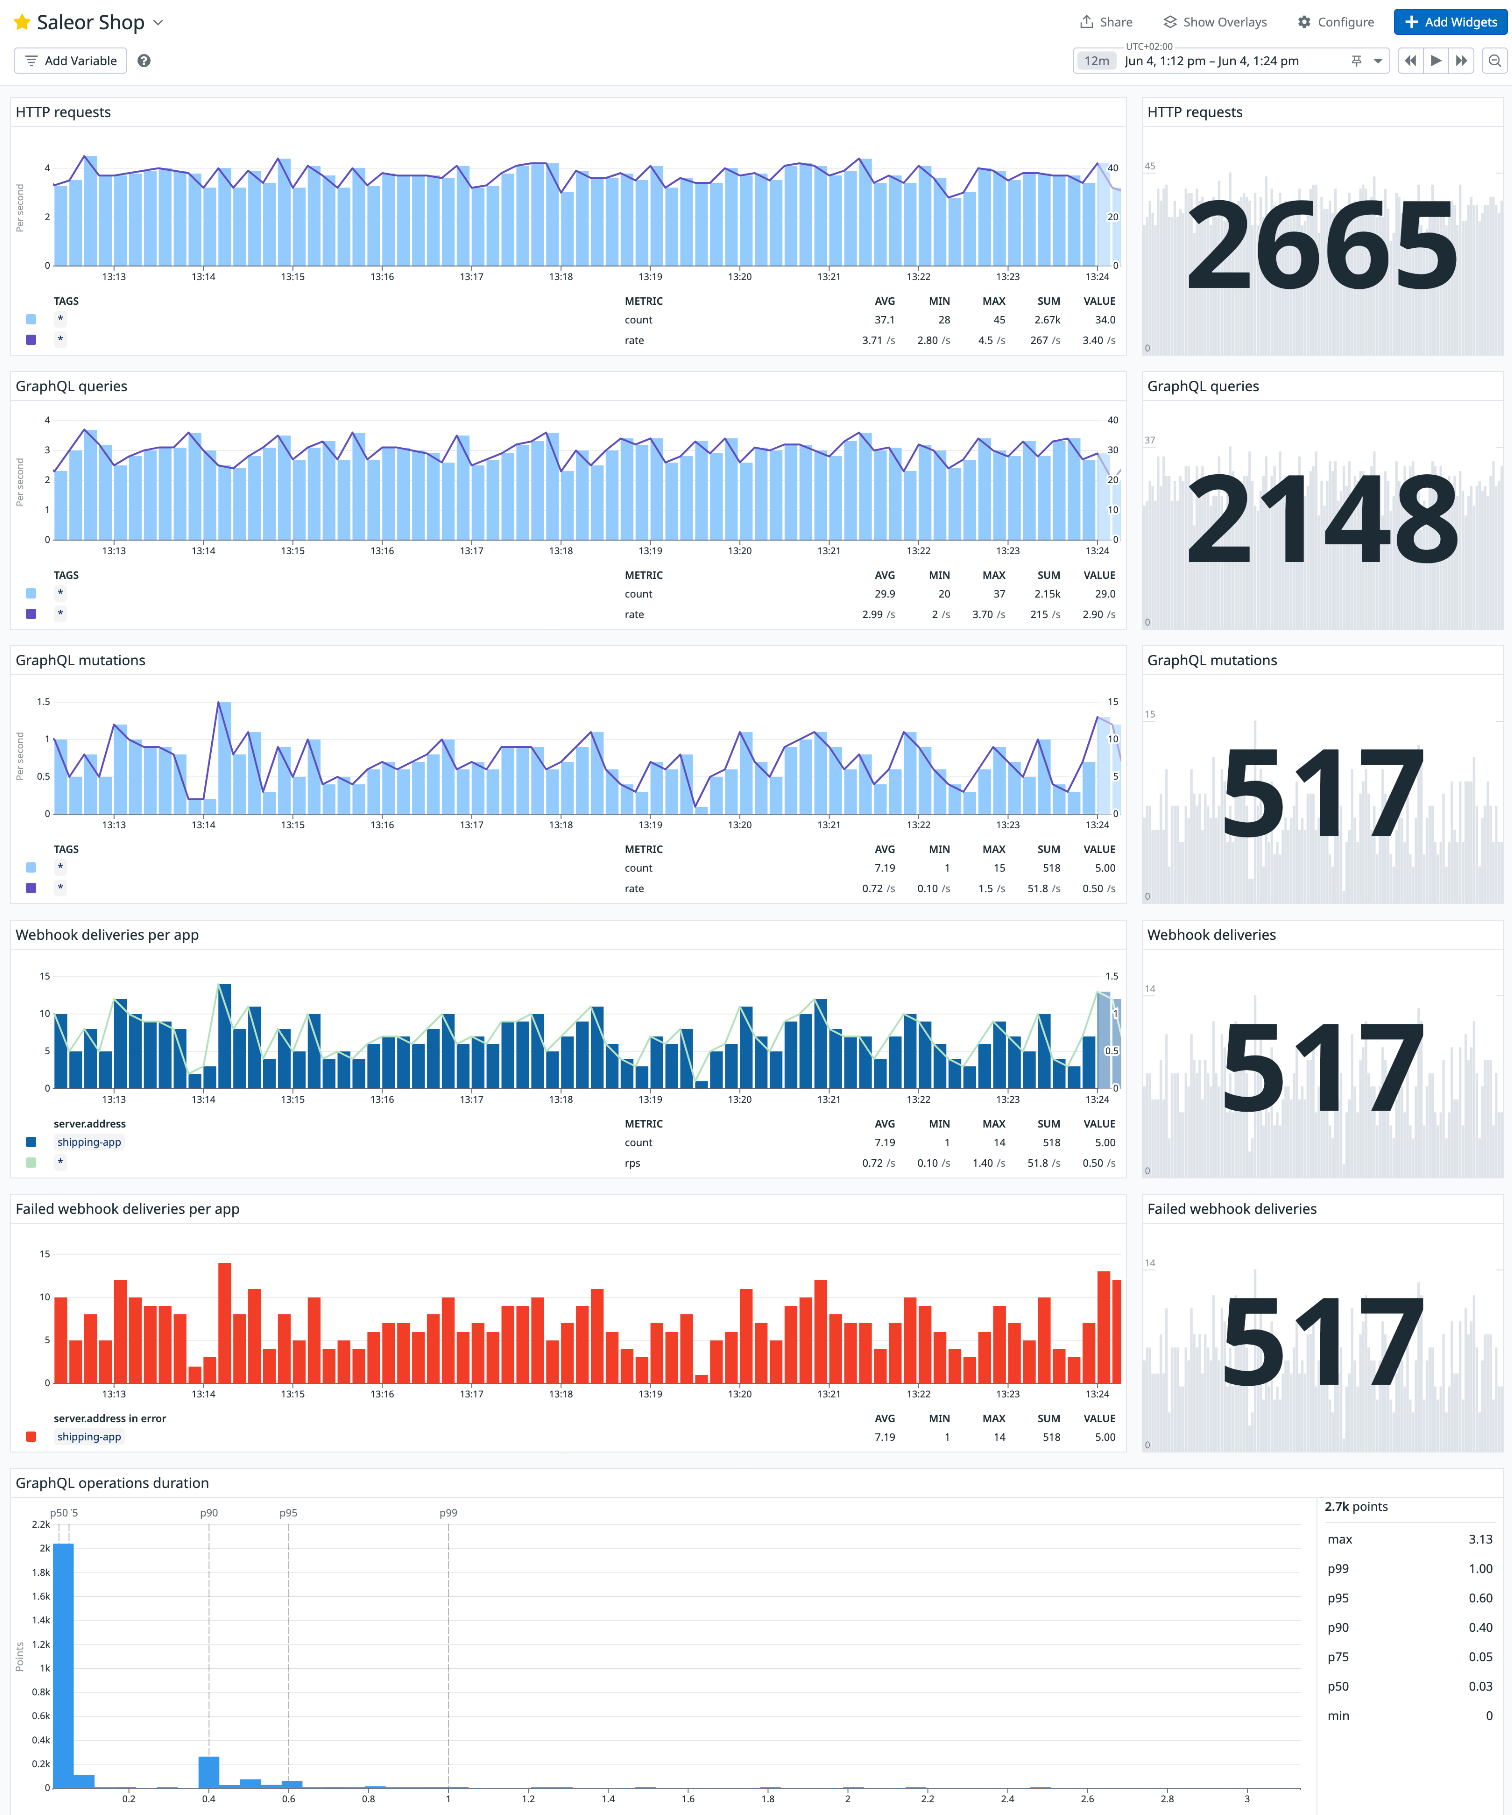
Putting Metrics to Work
With metrics flowing into our observability backend, we can build dashboards to see system health at a glance, spot trends and regressions over time, and set up alerts, for example:
- error rate > 5% for a key endpoint
p95latency above a threshold- queue depth exceeding normal levels
Metrics are also our primary tool for capacity planning. By tracking volumes and resource usage over time, we can plan scaling before we hit limits. They're the information source for the "health dashboard" of the system. Metrics don't tell the whole story, but they show when and where to start looking.
Logs: Providing Detailed Context
Logs are the third pillar of observability. They're essential for debugging specific errors, understanding business-level events around a failure, and maintaining security and audit trails.
OpenTelemetry enhances standard logging by correlating logs with traces and metrics:
- It integrates with standard logging APIs (for example, Python's
logginglibrary). - It attaches trace and span IDs to log records.
- When you investigate a slow or failing trace, you can jump directly to the relevant log entries for that exact request.
At Saleor, full OpenTelemetry log integration is still in progress, but the goal is clear: we want to fully integrate with OTel by generating all three signal types, including logs. That way, when we look at a problematic span or a metric spike, we can immediately see the correlated log entries right next to them, providing valuable context.
OpenTelemetry Collector
Once services are instrumented, they become sources of telemetry data, which can be delivered directly to observability backends. In many cases, though, it's better to send data through an intermediate node in the form of the OpenTelemetry Collector.
The Collector acts as an intermediary and is configured by declaring pipelines for each signal type (traces, metrics, logs). A pipeline typically looks like this:
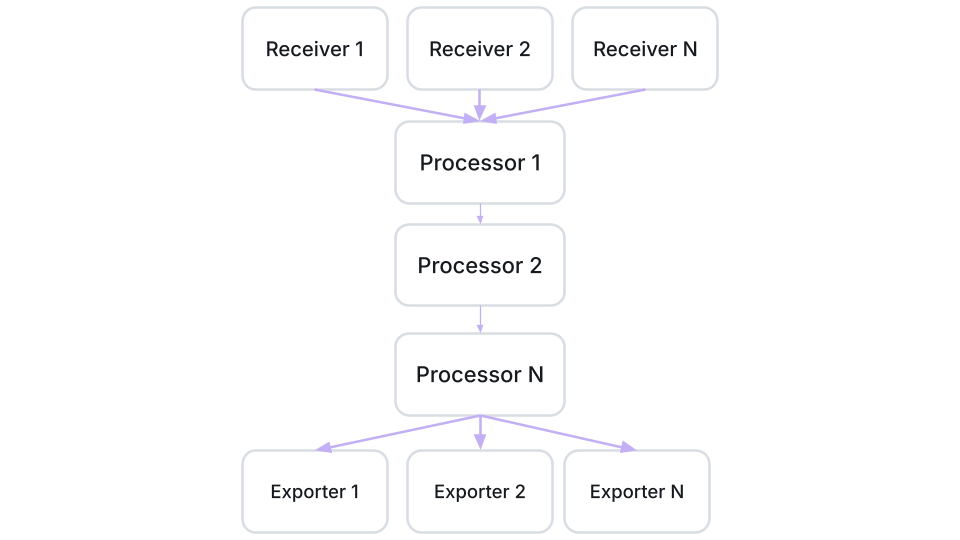
- Receivers - define how data arrives (e.g., OTLP over gRPC/HTTP)
- Processors - define what we do with it: batch data to reduce overhead, drop or filter what we don't need, enrich entries with extra attributes, aggregate or transform metrics
- Exporters - define where we send it (Datadog, Prometheus, Grafana, etc.)
The Collector gives us:
- a single place to handle retries, encryption, and transformations
- flexibility to change or add observability backends without reconfiguring every service
- and options to control volume and cost (for example, lowering cardinality or dropping noisy signals)
If you're operating multiple services around Saleor, the Collector is usually the central place where you shape telemetry data.
What's Next
OpenTelemetry is a huge and evolving ecosystem, and we're only at the beginning of what we can do with it in Saleor. It is a rarity to have such an insight in what’s happening under the hood of any SaaS.
This article was just an introduction to the basic concepts. In future posts, we plan to go deeper into practical scenarios, like how to integrate Saleor and Saleor apps with different observability backends, and how to build custom dashboards and alerts on top of that data.
If you're using Saleor today, give OpenTelemetry a try. We're excited to keep building on this foundation together with you, so let us know what works well and what you'd like to see next.